| Area | Santa Rosa |
| Topic | Fish: Trap Duration - Santa Rosa Cr 1993-1995 |
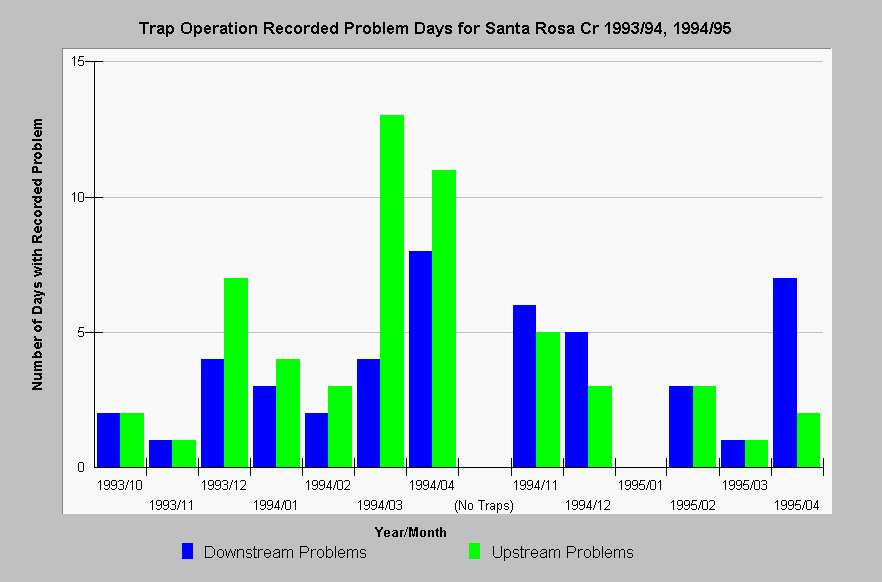
| Caption: This chart displays the number of days per month that a fyke net trap problem was recorded in Santa Rosa Creek. Codes were given for each day of trapping, both upstream and downstream, as follows: 1 = OK; 2 = net overwhelmed or wings not down; 3 = hole(s) in net; 4 = tampering. For this chart, problems days were those with codes 2 through 4. The overall trapping effort spans two winter/spring periods. Data were collected by Merritt Smith Consulting for the City of Santa Rosa. See InfoLinks for more information. Click on Map for location of trap sites. | |
 |
To learn more about this topic click Info Links .
To view additional information (data source, aquisition date etc.) about this page, click Metadata .
To view the table with the chart's data, click Chart Table web page.
To download the table with the chart's data, click fyketrap_crp_problems.xls.db (size 4,096 bytes) .
To view the table with the chart's source data, click Source Table web page.
To download the table with the chart's source data, click rr_day.dbf (size 202,998 bytes)
| www.krisweb.com |
